Blog by Neil FrancisPosted on Saturday 8th August 2020 at 8:39am
A recent article in The Guardian reports that most Queensland churchgoers support voluntary assisted dying (VAD), citing a recent YouGov poll commissioned by the Clem Jones Trust.
In fact, attitudes in support of VAD have been strengthening across Australia for many years, and the last few are no exception. In this analysis I explain, using impeccable Australian Election Study (AES) data gathered by a specialist team at Australian National University.
Each federal election, the AES gathers extensive demographic and attitudinal data from a substantial sample of Australians. That means we have comparable snapshots from each election in recent times, including 2019, 2016, 2013, 2010 and 2007 (though attitudes toward VAD have been asked only since 2016).
First up, given the well-documented strong connection between higher religiosity and less favourable attitudes towards VAD, let’s take a quick look at Australia’s changing religious landscape.
Abandoning religion: from trickle to torrent
Since federation, periodic census data collected by the Australian Bureau of Statistics (ABS) confirms a long-term decline in religious affiliation (Figure 1).
Figure 1: Religious affiliation in Australia by census year (ABS data) NOTE: Figures are nett of typically 10% non-response
Even this data generally overstates actual religious affiliation, compared with repeated good-quality polls. Census data has pegged religious affiliation typically 4-8% higher than do most polls.
That’s because until the most recent census (2016), collections had primarily or exclusively used a single, massive booklet for household completion. Mr Jones was unlikely to upset Mrs Jones by ticking the “No religion” box when he thinks she’s sure the family is Anglican, and she can see his answers. In contrast, relatives are not looking over the shoulder of an opinion poll respondent, which allows them to be more frank.
Additionally, a formal booklet is more likely to prompt respondents to answer in terms of historical household identity (a lagging indicator), while ad hoc surveys are more likely to prompt answers in terms of recent, pragmatic attitudes and practices (current indicator).
Abandoning religious identity
AES data clearly shows that for major denominations, Australians are leaving institutionalised religion in droves (Figure 2).
Figure 2: Religious affiliation by federal election year (AES data)
Over just 12 years Catholic affiliation has dropped from 28% to 21% (a drop of 26% of its flock); Anglican from 21% to 15% (-29%); and Uniting/Methodist from 8% to 4% (-52%). In total, minor Christian denominations have remained around the same, while non-Christian denominations have experienced a small increase, mostly from immigration.
But by far the most dramatic change over the 12 years is that No Religion has soared from 26% to 41% of the population, an increase of 61%. The largest increase was between 2016 and 2019, most likely a result of Australians’ dismay at the 2017 reports of the royal commission into institutional responses to the sexual abuse of children. It found that most offenses occurred in religious institutions, more than half of them in the Catholic church alone.
Abandoning religious practice
Not only have Australians been abandoning religious identity, but for the most part increasingly abandoning religious practice (Figure 3).
Figure 3: Almost never/never attend religious services (AES data)
At the same time as many Australians have abandoned religious identity, those still identifying with Catholic, Uniting, and non-Christians faiths are attending services less than before.
Overall, service attendance has remained about the same amongst minor Christian denominations, and there has been an increase amongst Anglicans (actually because far more Notionals — people who identify with a denomination but never attend religious services — have “left” the Anglican church).
Indeed, in 2019, fewer than half of Australians (47%) ever attend religious services, just a third (32%) attend more often than once in a blue moon, and a mere 16% are consistent attenders.
Clerics might still be talking, but fewer Australians than ever want to listen.
Abandonment to continue
Australians will continue to abandon religion given that most younger Australians reject religion at the same time that older, more religious Australians pass away (Figure 4).
Figure 4: Religion by age cohort 2019 (AES data)
This picture is even more dire for clerics than it was just three years earlier in 2016 (Figure 5).
Figure 5: Religion by age cohort 2016 (AES data)
Over the next 25 years the Catholic church and minor Christian denominations will struggle, while the Anglican and Uniting churches will almost cease to exist if current trends continue.
An integrated measure of religion
For further analysis, we’ll use the Australian Religious Identity 6-Factor (ARI6) model. It segments on the combined basis of religious attitudes and behaviour across a spectrum from Rejecters to Devouts.
Unsurprisingly over the past decade, Devouts have remained firmly entrenched in their faith (Figure 6), while there has been a small downward trend amongst Regulars.
Figure 6: Australian Religious Identity 6-Factor (ARI6) by year (AES data)
Most of the abandonment of religion in recent years has been amongst Occasionals, those who identify with a religious denomination but rarely attend services. This begs the question as to whether clerics were right to assume that they spoke for many in their flocks in the first place.
Attitudes toward VAD — Overall
Between 2016 and 2019 there was a small but statistically non-significant increase in total support for VAD, while there was no change in total opposition (Figure 7).
Figure 7: Australian adult attitudes toward VAD by year (AES data)
What is readily apparent, though, is a substantial increase in the number of Australians strongly in support of VAD (from 43% to 53%), while total opposition has remained tiny at fewer than one in ten Australians (9%).
Attitudes toward VAD — Religious affiliation
Amongst Australians who still count themselves as religiously affiliated in 2019, a majority of all religions except minor Christian denominations clearly favour VAD (Figure 8), including three quarters (74%) of Catholics, four in five Anglicans (78%) and Uniting/Methodists (81%), and almost all non-Christian religious (96%) and non-religious (92%).
Even amongst the minor Christian denominations with nearly half (49%) in support, just one in five (20%) were opposed to VAD, the rest being neutral.
Figure 8: Attitudes toward VAD by religious affiliation 2019 (AES data)
Strong support amongst Catholics increased massively from 36% in 2016 to 48% (close to half in strong support) in 2019, highlighting the irony of Catholic clergy continuing to actively oppose VAD law reform.
Given the tiny minorities opposed across the religious spectrum, those clerics who continue to vocally oppose the legalisation of VAD — including some employing serious misinformation — in no way are speaking for the majority of their flocks.
Attitudes toward VAD — Religiosity
Unsurprisingly, given the vast body of existing scholarly research evidence, opposition to VAD is largely religious (Figure 9).
Figure 9: Attitudes toward VAD by ARI6 2019 (AES data)
Nearly half of all opposition to VAD (44%) is of Devouts, with an additional quarter (26%) amongst Regulars and Occasionals, and a smaller proportion (17%) from Notionals.
Tellingly, even amongst the most religious, opposition to VAD has dropped significantly in just three years since 2016 (Figure 10). Opposition to VAD amongst Devouts dropped from nearly half (46%) to just over a third (35%), and amongst Regulars from 25% to just 15%.
Figure 10: Attitudes toward VAD by ARI6 2016 (AES data)
For 2019, proportions of the most opposed religious segment, Devouts, are almost evenly split amongst supporters, neutrals and opposers.
Amongst the next most religious, Regulars, supporters outnumber opponents by three to one, and in all the other segments supporters outnumber opponents by more than ten to one.
The evidence is clear: even amongst the most religious Australians, opposition to VAD is melting away.
The lowdown for politicians
What does this mean for legislators, who the community is asking to legalise VAD with responsible safeguards? Figure 11 shows VAD attitudes of Australians by the political party they identify with.
Figure 11: Attitudes toward VAD by political party identity 2019 (AES data)
It’s obvious why VAD Bills have been sponsored by Greens members and/or facilitated by Labor governments.
In contrast, Australian Coalition parliamentary parties (with notable exceptions of a handful of Coalition members) have steadfastly obstructed consideration and passage of VAD Bills. This is not because the party machinery is representing the broader Coalition voter, whose overall support stands at 74% versus a tiny 13% opposed. Rather, it’s because of the (widely reported) takeover of the party machinery by the religious right.
The natural home of VAD opponents is minor right parties, comprising overall a slight majority (53%) opposed to VAD. [Addendum: those identifying with minor right parties comprise just 3.1% of the adult Australian population.]
Given that minor right party voters are most likely to give their major party preference flow to the Coalition, the real concern for Coalition election strategists is to minimise first preferences going to a minor right party in the one or two electorates (if any) in which such a minor party win might even be on the cards.
The lowdown for election candidates
It’s been a firm belief among the political class for a long time that candidates openly supporting VAD would be punished at the polls on election day, with little to no downside for candidates opposed to VAD. That, however, is fake news.
A 2012 Newspoll survey asked voters if, all other things being equal, they would change their vote if their otherwise preferred election candidate’s stance was the opposite of their own (support vs opposition). (Full disclosure: as CEO of YourLastRight.com I commissioned the survey.)
VAD-supporting voters stated they would punish their preferred candidate (opposing VAD) at three times the net rate that VAD-opposing voters would punish a supporting candidate. I’ve subsequently published various other observations that are consistent with this finding.
Now that strong support for VAD amongst the Australian public is significantly higher than it was in 2016 (let alone 2012), it would be foolhardy for any supportive politician to hide their light under a bushel, or for an opposed candidate to effectively thumb their nose at the majority of voters.
I’m reminded of a favourite remark of Sir Humphrey Appleby (Nigel Hawthorn) in the 1980s British political comedy series Yes Minister, who would gently point out his Minister’s policy folly (Jim Hacker played by Paul Eddington) with the light remark, “that would be very courageous, Minister!”
It’s now a very courageous candidate indeed who believes their personal opposition to VAD ought to trump the support of the vast majority of their constituency. And, given the ongoing abandonment of religion in Australia, such candidates will soon find themselves on the wrong side of history.
The lowdown for campaigners and voters
Given that most Australians — increasingly including the religious — are in favour of responsible VAD law reform, and with a growing proportion strongly in support, it’s more important than ever to determine election candidates’ real attitudes toward VAD.
Some candidates provide prompt and candid responses to help voters decide. But many candidates obfuscate, either failing to respond at all or responding with non-answers such as they haven’t seen specific legislation yet so cannot answer, or cynically stating only the obvious such as “opinions vary” and it can be “an emotive issue”.
The key action with obfuscators is to get a real answer to the question “could there be any version of a VAD Bill that could enjoy your support?” And assume those who still obfuscate would have said “no”, had they been candid.
Blog by Neil FrancisPosted on Monday 30th October 2017 at 11:20pm
With a handful of exceptions, the Coalition has demonstrated itself to be 'unrepresentative swill' on assisted dying law reform.
It was with tongue in cheek that I recently quoted former Prime Minister Paul Keating to wonder if politicians voting on assisted dying Bills were ‘unrepresentative swill.’ The now-obvious answer to this question has become more than just humorous, with the publication yesterday of the Hansard record of Victoria’s Legislative Assembly vote on the Voluntary Assisted Dying Bill 2017.
How ironic it was that the very day after I quoted Keating’s slight against his then-hostile Senate, Keating himself, a conservative Catholic, would come out against voluntary assisted dying (VAD) reform.
Hansard record makes compelling reading
But, more importantly, the Hansard record of votes on the Victorian Bill in the lower house make for compelling reading.
Figure 1 shows Victorian voter support for VAD (from ANU Australian Election Study 2016 data) by political preference, and MP votes in support of the Victorian Bill (lower house, 2017).
Figure 1: Victorian electorate support and MP vote support for VAD (lower house, 2017) Sources: AES 2016; Hansard
It’s quite obvious that Greens MPs (100% v 91%) , Labor MPs (86% v 84%) and minor/independent MPs (67% v 76%) approximately represented the proportion of voter support. (It’s unsurprising that all Greens MPs vote in favour of VAD Bills: it’s Greens policy; while it’s a ‘conscience’ matter for other parties.)
The yawning Coalition chasm
But the yawning chasm of Coalition MPs not representing their own voters (14% v 73%) is even more stark. That’s a gap of nearly sixty percentage points. Surely that would be enough to raise the eyebrow of any conservative voter?
Aside from a handful of Coalition MPs who voted in support of the VAD Bill, it’s clear that there’s generally no real ‘conscience’ vote across the Coalition benches.
The corridors have been buzzing with stories of threats to Coalition promotions and preselections, and threats to preference deals for the state election next year, though of course there’s nothing public and on the record. Just the serene statement that “our members have a conscience vote.” The discrepancy amongst Australian Coalition ranks has been formally uncovered before in university research.
It’s a national story
However, it’s not like this is confined to Victoria. Here’s the same chart (Figure 2) for all state VAD bills across Australia since 2000 which have had a division on the vote — so we know who voted which way.
Figure 2: Australian electorate support and state MP vote support for VAD (all state Bills since 2000) Sources: AES 2106; Hansards
Again, the largest and most striking gap between voter desire for reform and MPs opposing their voters’ wishes is amongst the Coalition ranks, at a full sixty percentage points short of proper representation.
It’s a similar picture to that published by university researchers in 2008, who found just 17% Coalition voting support in favour of VAD in the federal parliament, too.
As I’ve explained before, the Party leader’s public statements can be ‘persuasive,’ and Mr Matthew Guy, leader of the Victorian Parliamentary Coalition, has made his entrenched opposition to this reform loud and clear.
Inform your own voting
As debate in Victoria’s upper house commences tomorrow, we’ll be watching who’s in favour and who’s against. And we’ll report the voting record to help inform how you cast your own vote at Victoria’s state election in November next year.
In the meantime, here’s the full record of the Victorian Legislative Assembly votes.
Full voting record – Victorian Legislative Assembly 2017 VAD Bill
Ayes
47
Noes
37
Allan, Jacinta
Labor
Angus, Neil
Liberal
Andrews, Daniel
Labor
Battin, Brad
Liberal
Britnell, Roma
Liberal
Blackwood, Gary
Liberal
Bull, Josh
Labor
Blandthorn, Lizzie
Labor
Carroll, Ben
Labor
Bull, Tim
Nationals
Couzens, Chris
Labor
Burgess, Neale
Liberal
D'Ambrosio, Lily
Labor
Carbines, Anthony
Labor
Dimopoulos, Steve
Labor
Clark, Robert
Liberal
Donnellan, Luke
Labor
Crisp, Peter
Nationals
Edbrooke, Paul
Labor
Dixon, Martin
Liberal
Edwards, Maree
Labor
Fyffe, Christine
Liberal
Eren, John
Labor
Gidley, Michael
Liberal
Foley, Foley
Labor
Guy, Matthew
Liberal
Garrett, Jane
Labor
Hodgett, David
Liberal
Graley, Judith
Labor
Kairouz, Marlene
Labor
Green, Danielle
Labor
Katos, Andrew
Liberal
Halfpenny, Bronwyn
Labor
McCurdy, Tim
Nationals
Hennessy, Jill
Labor
McLeish, Cindy
Liberal
Hibbins, Sam
Greens
Merlino, James
Labor
Howard, Geoff
Labor
Northe, Russell
Ind.
Hutchins, Natalie
Labor
O'Brien, Danny
Nationals
Kealy, Emma
Nationals
O'Brien, Michael
Liberal
Kilkenny, Sonya
Labor
Pesutto, John
Liberal
Knight, Sharon
Labor
Richardson, Tim
Labor
Languiller, Telmo
Labor
Riordan, Richard
Liberal
Lim, Hong
Labor
Ryall, Dee
Liberal
McGuire, Frank
Labor
Ryan, Steph
Nationals
Morris, David
Liberal
Smith, Ryan
LIberal
Nardella, Don
Ind.
Smith, Tim
Liberal
Neville, Lisa
Labor
Southwick, David
Liberal
Noonan, Wade
Labor
Suleyman, Natalie
Labor
Pakula, Martin
Labor
Thompson, Murray
Liberal
Pallas, Tim
Labor
Tilley, Bill
Liberal
Paynter, Brian
Liberal
Wakeling, Nick
Liberal
Pearson, Danny
Labor
Walsh, Peter
Nationals
Perera, Jude
Labor
Watt, Graham
Liberal
Sandell, Ellen
Greens
Wells, Kim
Liberal
Scott, Robin
Labor
Sheed, Suzanna
Ind.
Spence, Ros
Labor
Staikos, Nick
Labor
Staley, Louise
Liberal
Thomas, Mary-Anne
Labor
Thomson, Marsha
Labor
Ward, Vicki
Labor
Williams, Gabrielle
Labor
Wynne, Richard
Labor
TOTAL AYES
TOTAL NOES
Labor
38
Labor
6
Greens
2
Greens
0
Liberal
4
Liberal
24
National
1
National
6
Other
2
Other
1
TOTAL
47
TOTAL
37
Abstained
2
Asher, Louise
Liberal
Victoria, Heidi
Liberal
Did not vote
1
Brooks, Colin
(Speaker, Labor)
Note: The vote represents 87 of 88 seats. The seat of Northcote was vacant owing to the untimely death of its representative, Fiona Richardson, from cancer.
Fact file by Neil FrancisPosted on Thursday 25th May 2017 at 12:00am
Those actively opposing assisted dying laws are Australia's most religious. Photo: Donaldytong
A claim was recently made on ABC’s QandA that at least 70% of Catholics and Anglicans support assisted dying. The claim was challenged and a FactCheck prepared and vetted by scholars. They concluded that some but not all polls supported the statement. I show unambiguously that relevant polls do. I show further, as I have in the past, that opposition is largely associated with Australia's most religious.
In 2007, a Newspoll survey found that 74% of Catholics and 81% of Anglicans support assisted dying. The 2016 Australian Election Study (AES), run by scholars at Australian National University, found almost identical rates: 74% of Catholics and 79% of Anglicans. Although a majority of all religious denomination groups support assisted dying, opposition is highest among minor Christian denominations (Figure 1).
Figure 1: Attitudes toward assisted dying by major religious denominations Source: AES 2016. Note: Chr. = Christian
A significant majority of support for assisted dying was also found across all age groups, education levels, income levels, states, and major political party affiliations and religious denominations, with support amongst Australians overall at 77%.
Casting doubt
However, another poll cited in the FactCheck found far less support: the 2011 National Church Life Survey (NCLS). It found just 28% of Catholics and 25% of Anglicans supported assisted dying.
The problem with the NCLS poll is that it didn’t take a valid sample of Australian Catholics and Anglicans. It sampled mostly or only those who frequently attend religious services.
Views vary widely by attendance frequency
Figure 2 shows the level of support amongst the Australian public, by frequency of attending religious services. While just 2.4% of those who never attend religious services oppose assisted dying, 46.1% of those attending at least once a week oppose it.
Figure 2: Attitudes toward assisted dying by frequency of attending religious services Source: AES 2016
NCLS poll cannot answer the question
The NCLS results were even more negative than the AES ‘at least once a week’ results. That’s explained by the NCLS methodology. Firstly, occasional attenders were underrepresented, and non-attenders were excluded altogether. Secondly, more church employees (the most deeply committed and aligned with church policies) than others would have participated. Thirdly, responders may have felt pressured to toe the church line because the survey forms were collected by the churches themselves. And fourthly, those who disagreed with the church line would be less likely to participate.
ABC QandA question answered
So we can discount the NCLS poll because it was not suited to answer the question about all Australian Catholics and Anglicans.
On that basis, it is not only reasonable to say that “up to 70% of Catholics and Anglicans support assisted dying,” but to say that “at least 70% of Catholics and Anglicans support assisted dying.”
Religious connections of opposers
But, back to the opposition of assisted dying. AES data shows that 92% of those opposing and 94% of those strongly opposing assisted dying have a religious affiliation (self-identify with a religious denomination) or attend religious services. So, while a tiny minority of opposers had no religious affiliation nor attended religious services, almost all those opposing have a religious connection.
Frequent service attendance entrenches opposition
If we focus in on those who identify with a religious denomination and who disagree with assisted dying, we find that there’s a massive difference in opposition to assisted dying between the ‘at least once a week’ attenders and everyone else (Figure 3).
Figure 3: Frequency of attending religious services amongst those with a religious affiliation and who disagree with assisted dying Source: AES 2016
Not only are the majority of opposers weekly religious service attenders, but weekly attenders are more likely to be strongly opposed. This highlights the strong alignment with and commitment to religious teachings, which (with rare exceptions) oppose assisted dying.
If we define the most religious Australians as those who attend religious services monthly or more often and who self-identify with a religious denomination (“Regulars” in Figure 4), and who make up just 15.7% of the population, their attitudes are remarkably more opposed to assisted dying than all other Australians — by a factor of more than eleven to one.
Figure 4: Attitudes by religious service attendance plus denomination affiliation (“Regulars”) Source: AES 2016
Amongst the 84.3% of Australians who are not “Regulars”, almost all of them (85.7%) agree with assisted dying, and almost none of them (3.6%) disagree.
Demographic differences explained by religiosity
The variation in attitudes toward assisted dying by general demographics is largely explained by religiosity — defined here as ‘the frequency of attending religious services’.
For example, the increased opposition amongst older Australians is explained by their increased religiosity. The same applies to religious denomination affiliation (e.g. Catholics attend services more often than Anglicans), education, urban versus rural residence, and political party first preference.
Religiosity was the only variable that independently explained variations in opposition to assisted dying.
The double whammy — affiliation and attendance
Also informative is the comparison of those with or without a religious affiliation versus those who do and don’t attend religious services. (Australians fall into all four categories.)
Amongst those with no religious affiliation, people who do attend religious services are only slightly less likely (than those who don’t attend) to support assisted dying (-7%), and their difference in attitude is mostly to neutrality.
However, of those with a religious affiliation, people who do attend religious services are significantly less likely to support assisted dying (-27%), and the majority of their difference in attitude is opposition rather than neutrality.
Thus, those more deeply aligned with their religious denomination through service attendance are significantly more likely to oppose assisted dying.
Moderated by personal experience
The 2007 Newspoll study asked respondents if they had personal experience of someone close who was hopelessly ill and had wanted voluntary euthanasia.
Amongst those with no religious affiliation, this personal experience increased support for assisted dying by just 3.7%, because support was already very high: from 90.9% to 94.6%.
However, amongst those with a religious affiliation, personal experience increased support for assisted dying markedly by 15.2%: from 72.4% to 87.6%.
Thus, those attending religious services, yet with close, personal experience of hopeless illness with a desire for assisted dying, were significantly less likely to align with opposed religious doctrine.
The most religious are a small minority
With so much opposition amongst Australia’s most religious, why is overall support for assisted dying so high? It’s because Australia’s most religious are a small minority of the population.
Nearly half (48%) of Australians never attend religious services, two thirds (65%) attend less than once a year or never, and three quarters (75%) attend once a year or less, including never.
Those who attend religious services frequently (weekly or more often) comprise just 12% of the population, while those who attend regularly (monthly or more often which includes the weeklies) comprise 16%.
Religion in Australia has been declining for decades, and the fall is likely to continue (see Appendix A of the full report, here), meaning that support for assisted dying is likely to increase in the future.
Conclusions
I’ve previously demonstrated how all the signatories to a major anti-assisted dying advertisement were deeply connected with religion. The AES and other studies further our understanding of wider public attitudes toward assisted dying in Australia. They show that while a substantial majority of Australians support assisted dying, almost all the opposition to it is connected with religion, particularly amongst the most religious who are a small minority of the population.
Despite the religious connection of those opposed, there is ample, robust evidence that a great majority of Catholic and Anglican Australians support assisted dying, backing the claim made on national television.
Clergy opposing assisted dying are not representing the broader views of their flocks. Perhaps they may not see that as their role, and perhaps this misalignment of attitudes and beliefs is an example of why religion in Australia is declining.
However, reflecting the views of the great majority of the constituency is the role of politicians, who would do well to take note of this robust evidence of a significant majority of support for assisted dying.
 Figure 1: Religious affiliation in Australia by census year (ABS data)
 Figure 2: Religious affiliation by federal election year (AES data)
 Figure 3: Almost never/never attend religious services (AES data)
") Figure 4: Religion by age cohort 2019 (AES data)
Figure 4: Religion by age cohort 2019 (AES data)") Figure 5: Religion by age cohort 2016 (AES data)
Figure 5: Religion by age cohort 2016 (AES data)") Figure 6: Australian Religious Identity 6-Factor (ARI6) by year (AES data)
Figure 6: Australian Religious Identity 6-Factor (ARI6) by year (AES data) Figure 7: Australian adult attitudes toward VAD by year (AES data)
 Figure 8: Attitudes toward VAD by religious affiliation 2019 (AES data)
 Figure 9: Attitudes toward VAD by ARI6 2019 (AES data)
 Figure 10: Attitudes toward VAD by ARI6 2016 (AES data)
 Figure 11: Attitudes toward VAD by political party identity 2019 (AES data)
") Figure 1: Victorian electorate support and MP vote support for VAD (lower house, 2017)
Figure 1: Victorian electorate support and MP vote support for VAD (lower house, 2017)") Figure 2: Australian electorate support and state MP vote support for VAD (all state Bills since 2000)
Figure 2: Australian electorate support and state MP vote support for VAD (all state Bills since 2000)
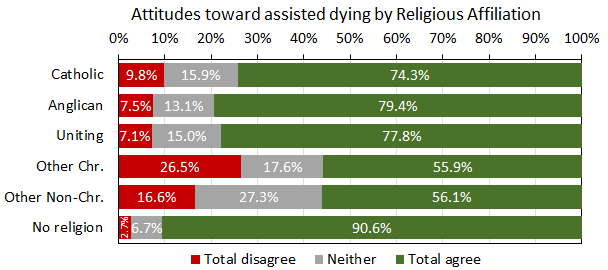 Figure 1: Attitudes toward assisted dying by major religious denominations
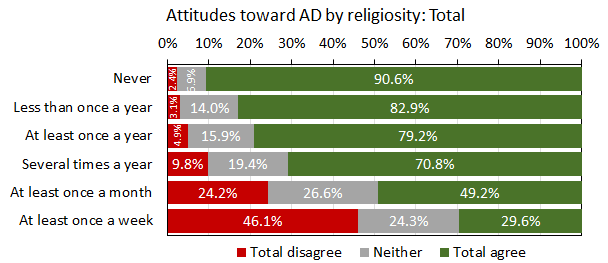 Figure 2: Attitudes toward assisted dying by frequency of attending religious services
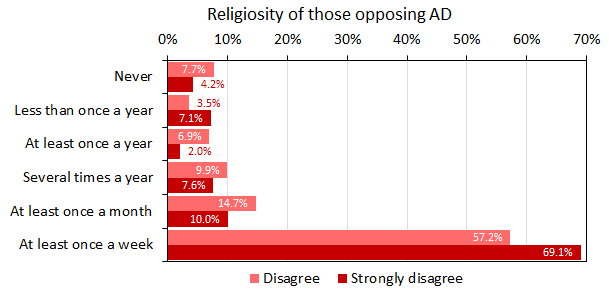 Figure 3: Frequency of attending religious services amongst those with a religious affiliation and who disagree with assisted dying
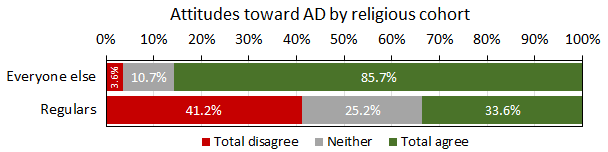 Figure 4: Attitudes by religious service attendance plus denomination affiliation (“Regulars”)